Real-Time: Real Estate Price Prediction
Introduction
In the field of real estate, the idea of predicting the “right price” for a property is growing heavily in interest. Most current algorithms solely use statistical information about given properties as a form of input to predict its right price. However, these algorithms fail to include a notable form of data that often influences the perception of a buyer: images of the house. Fortunately, in recency, convolutional neural networks (CNNs) have increased in prominence for their ability to generate strong feature representations out of images and use those representations to accurately map to scalar/vectorized outputs.
Yet, as explored in the 2021 project, creating a dataset of strongly-labelled pictures and corresponding statistical information for homes in the Greater Toronto Area (GTA) w.r.t. houses sold at a single point in time is a difficult task. A MAPE error of 15% was generated through extensive hyperparameter tuning on a dataset of 500 houses. However, this number is far behind current MAPE benchmarks developed through numerical datasets only. Furthermore, on the numerical side of things, high quality GTA residential datasets that contain a wide variety of house attributes are far and few to be found.
The lack of high-quality GTA datasets lead to the core goal of this sequel RealValue project, which is to create a dataset centered around GTA homes that is extensive, usable and informative. The metric to measure success in executing this goal is the MAPE that different experiments are able to generate.
The project is considered a success if the project achieves 7.5% MAPE error, which is 1/2 of the best error from the 2021 project.
Framework
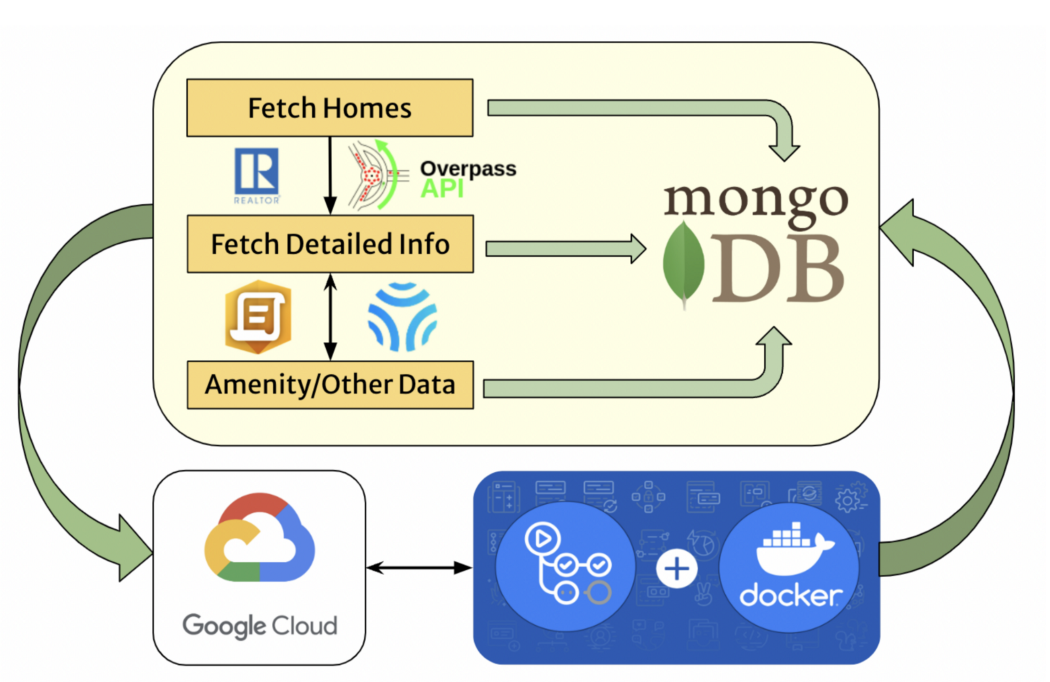
Data Collection Process The data collection process is an iterative process that involves fetching the house data through an API request, saving this data into the database, and updating the data with more detailed house information and amenities periodically. This process is an automated process and executes every 12 hours to ensure the database is always giving up-to-date and reliable information. To automate this process, GitHub Actions were used to create Docker container actions. The actions were operated on a Google Cloud Virtual Machine, ensuring that the hardware is consistent and can reliably update the database. The database of choice is MongoDB due to its fast data access for read/write operations.
Dataset The final dataset is comprised of over 30,000 homes across Toronto. Each contains numerical and categorical attributes such as number of bedrooms, bathrooms, and type of house, as well as over 40 amenities, including nearby public transit, restaurants, schools. This is a major improvement upon last year’s project, which only consisted of 157 homes with very limited corresponding attributes. However, 65% of the dataset did not possess corresponding images, resulting in a different training approach.
Model
Training was conducted in two parts:
- Training without images (17,000 homes)
- Training with images (6000 homes)
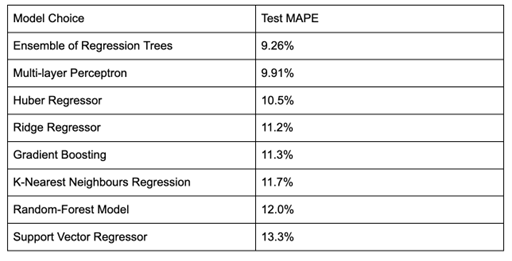
Training without images involved testing 8 different regressor models
- Support vector regressor was chosen due to its strength in working with higher-dimensional data and reducing prediction errors to a certain range
- Multi-layer perceptron was chosen due to their wide use in machine learning and their capacity to solve complex problems
- Ensemble of regression trees was used due to the fact that they leverage a diverse set of regressors, which can then be averaged, reducing the impact of outliers
- Gradient boosted decision trees were used due to their improved performance compared to random trees through the optimization of loss functions
- K-nearest neighbours regression was used due to its simplistic implementation, lack of assumptions required, and prior use for the task of housing price prediction
- Random-forest model was chosen due to its ability to create a more diverse set of regressors, similar to the ensemble of regression trees, but also its ability to control overfitting and improve accuracy
- Huber regressor was used due to it being less sensitive to outliers as a result of its loss function, making it useful for larger datasets like the housing price one curated
- Ridge regressor was utilized due to its effectiveness at preventing overfitting resulting from its regularization loss term
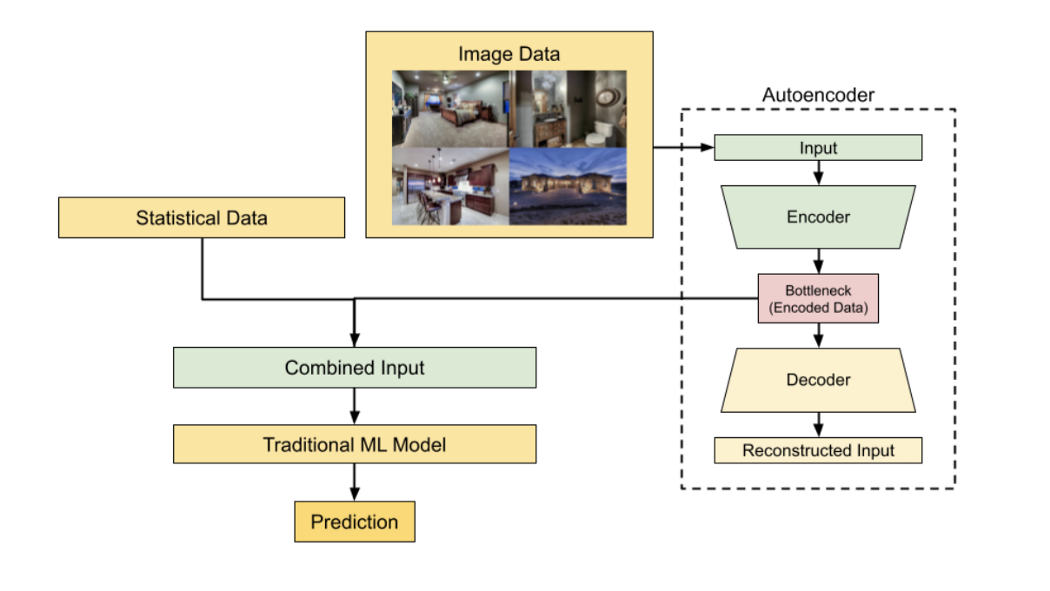
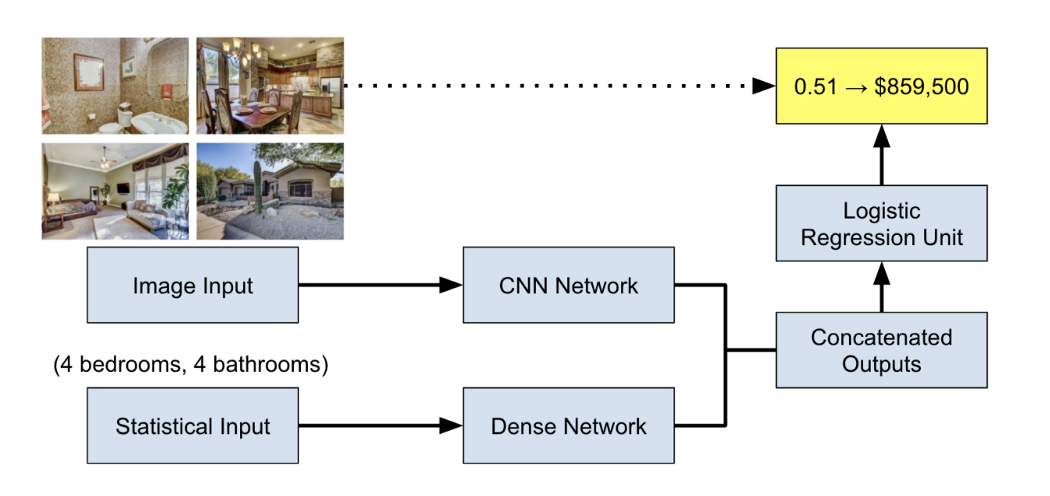
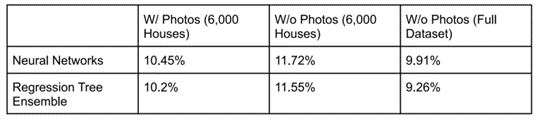
Training with images involved testing the best of the 8 regressors (regression tree ensemble) against a CNN network (EfficientNetB0). EfficientNetB0 was chosen due to its high accuracy on image classification problems
Results
Without images
With images
Future works
We are continuing this project as RealTime-2 in 2022, where we will aim to beat the state-of-the-art MAPE score of 7.5% (Real-ime MAPE: 9%). We will be focusing on making request allocations more efficient to serve more homes and drawing upon further data sources and integrating more APIs to build a wider dataset while maintaining a high length. For more details, please visit https://utmist.gitlab.io/projects/realtime2/.
